1% Progress Graph: How It's Measured
Written by: Kunal Keshan • 3/13/2024 • 1 min read
At Touch Grass, we believe in the power of incremental progress and the importance of tracking your improvement over time. That's why we've introduced the 1% Progress Graph feature, designed to give you deeper insights into your growth journey. In this article, we'll explore how this feature works and how it can help you stay motivated and focused on your goals.
Understanding 1% Progress Calculation
The 1% Progress Graph measures your improvement over time using a unique calculation method. Here's how it works:
-
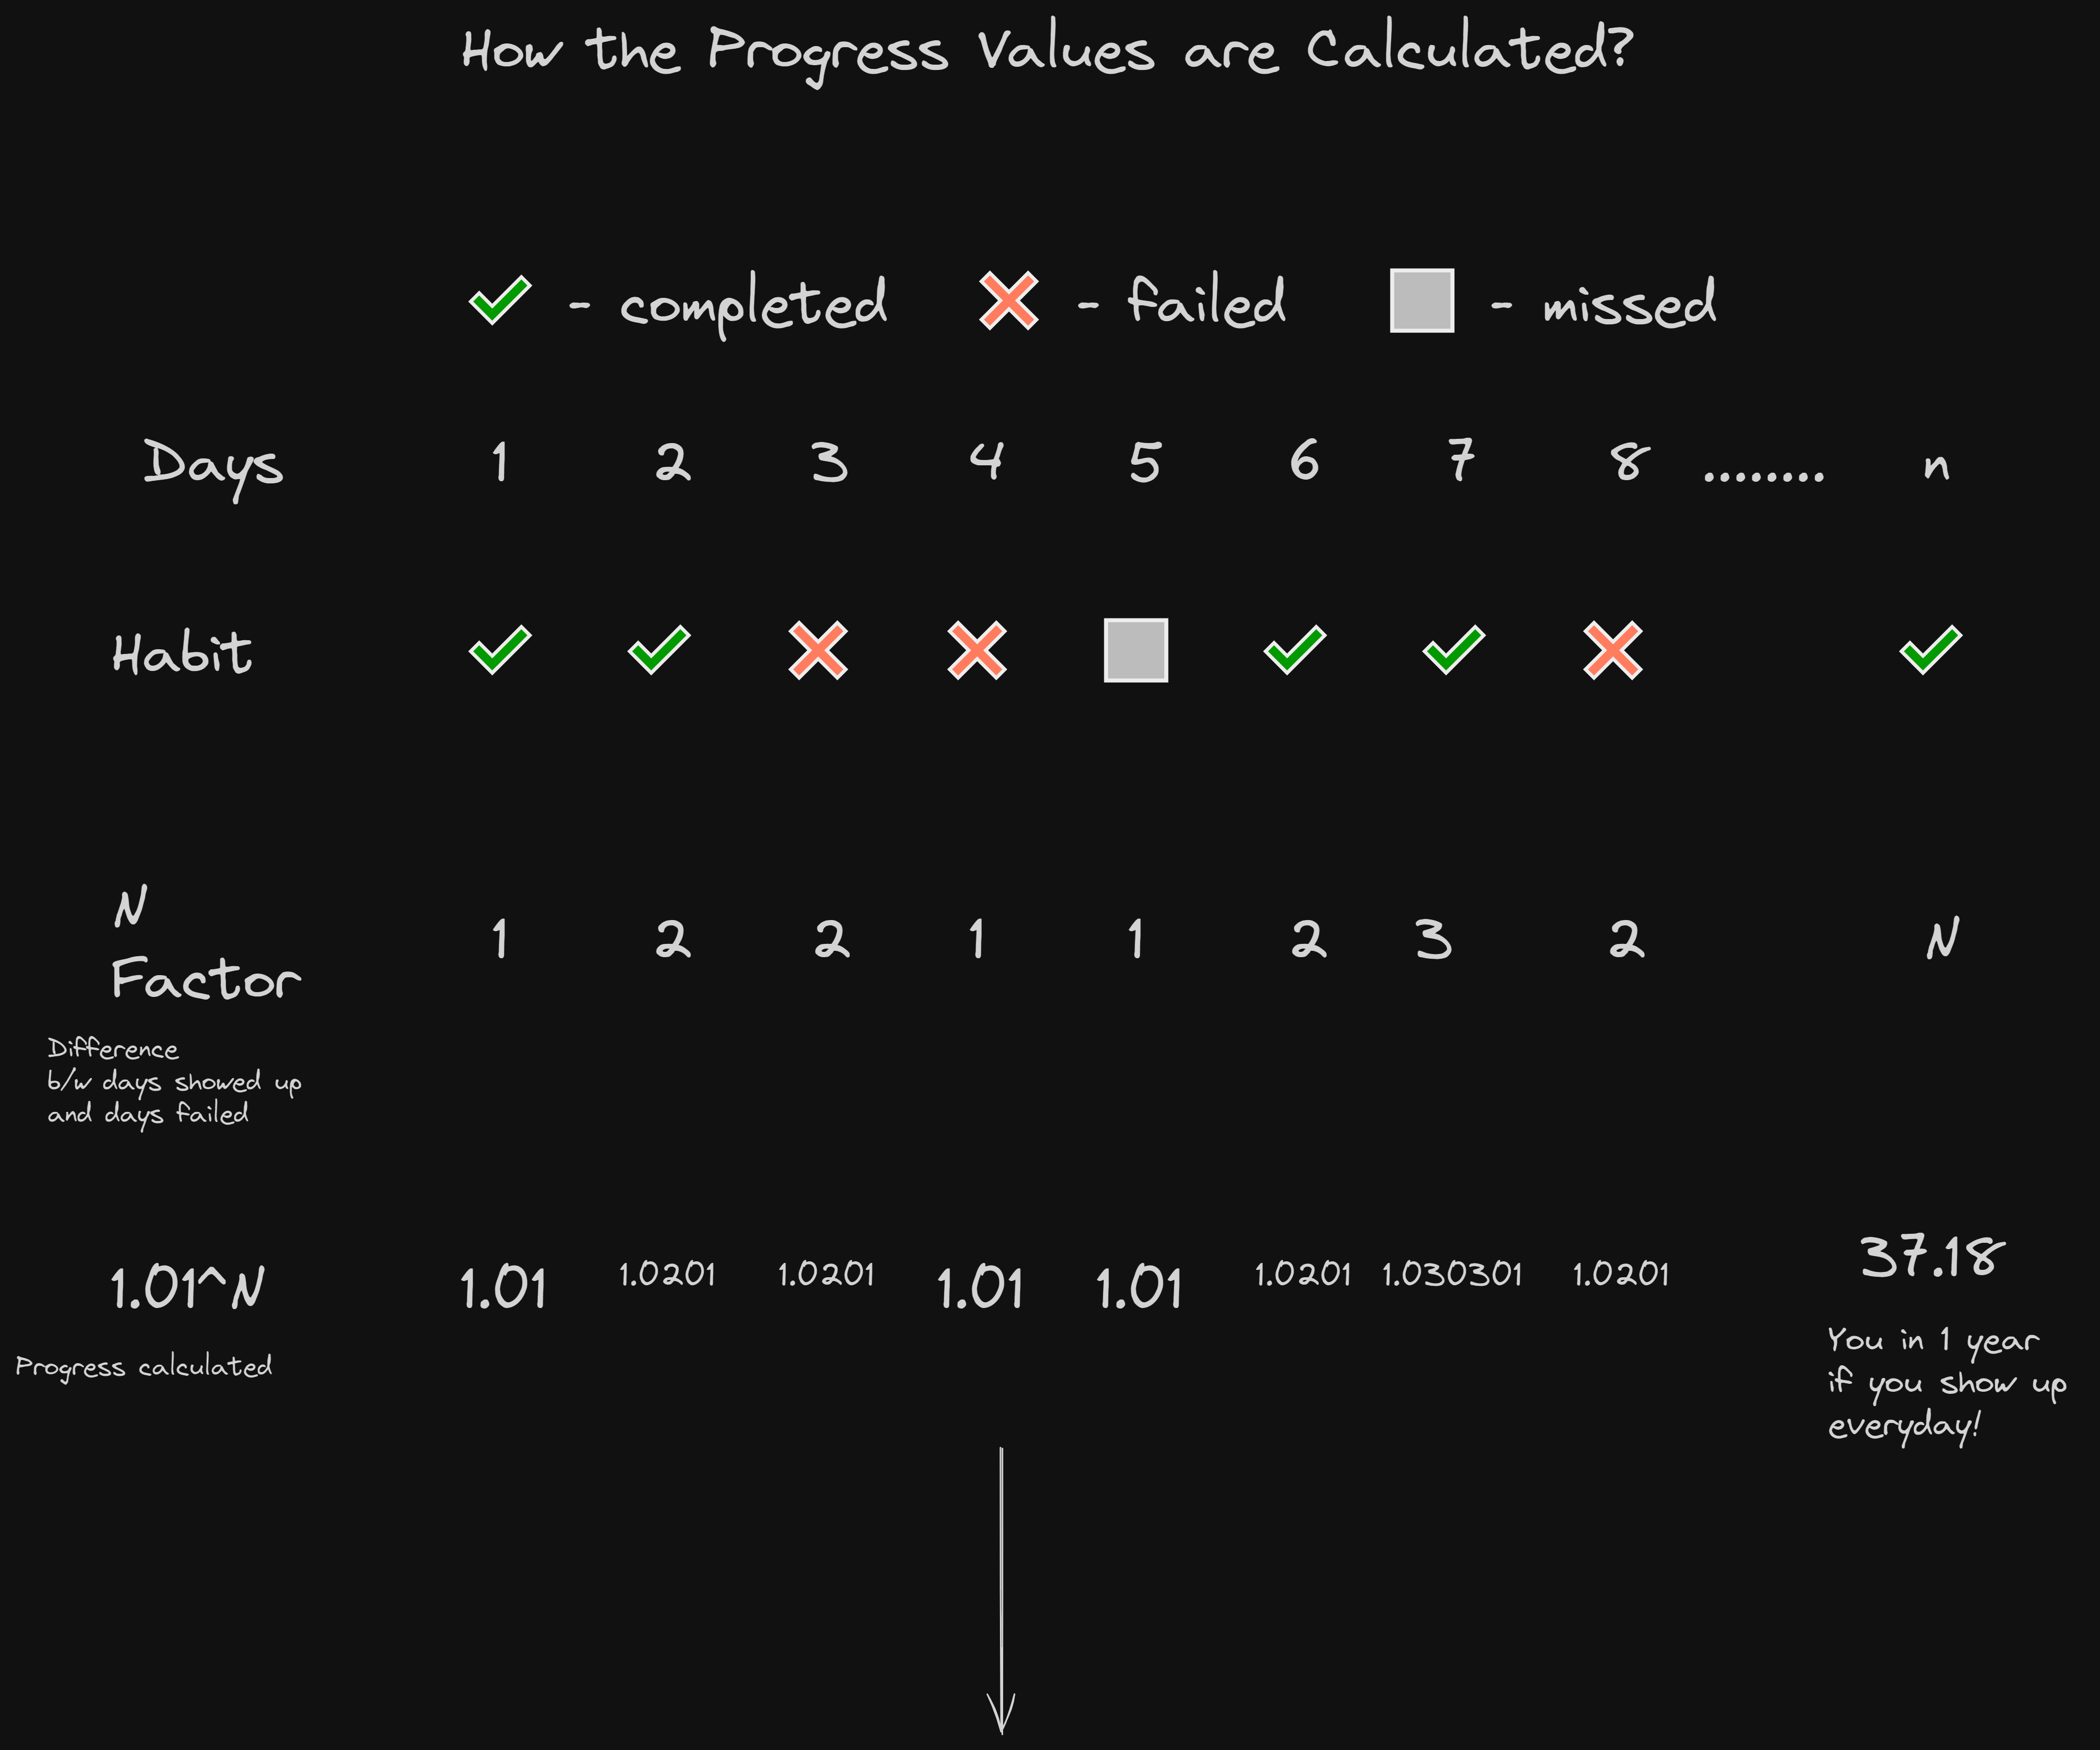
Daily Tracking: For each habit you track, we record whether you've shown up (completed) or not (failed) on a daily basis.
-
Calculating Difference: We calculate the difference between the number of days you've completed the habit and the number of days you've failed to complete it. Let's call this difference "N".
-
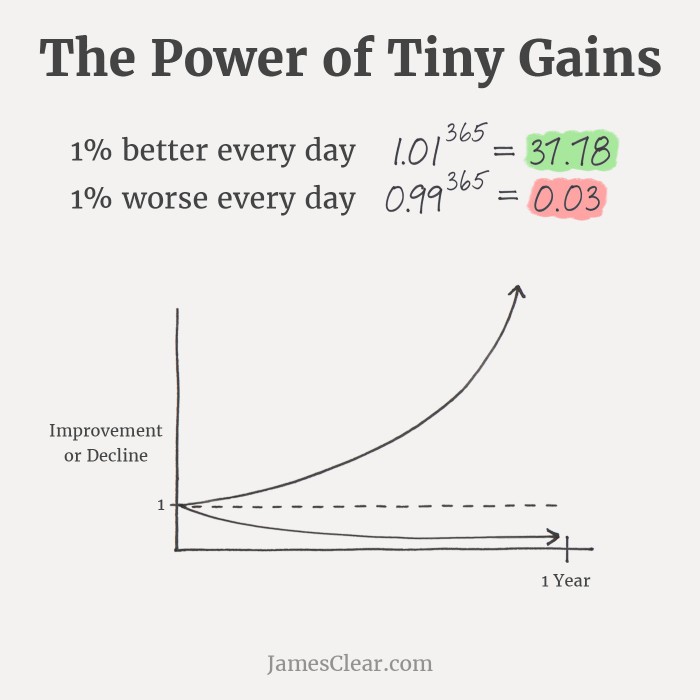
1% Progress Formula: We use the formula (1.01 ^ N) to calculate your progress for each day. This means that for every day you've shown up, your progress is multiplied by 1.01, representing a 1% improvement.
-
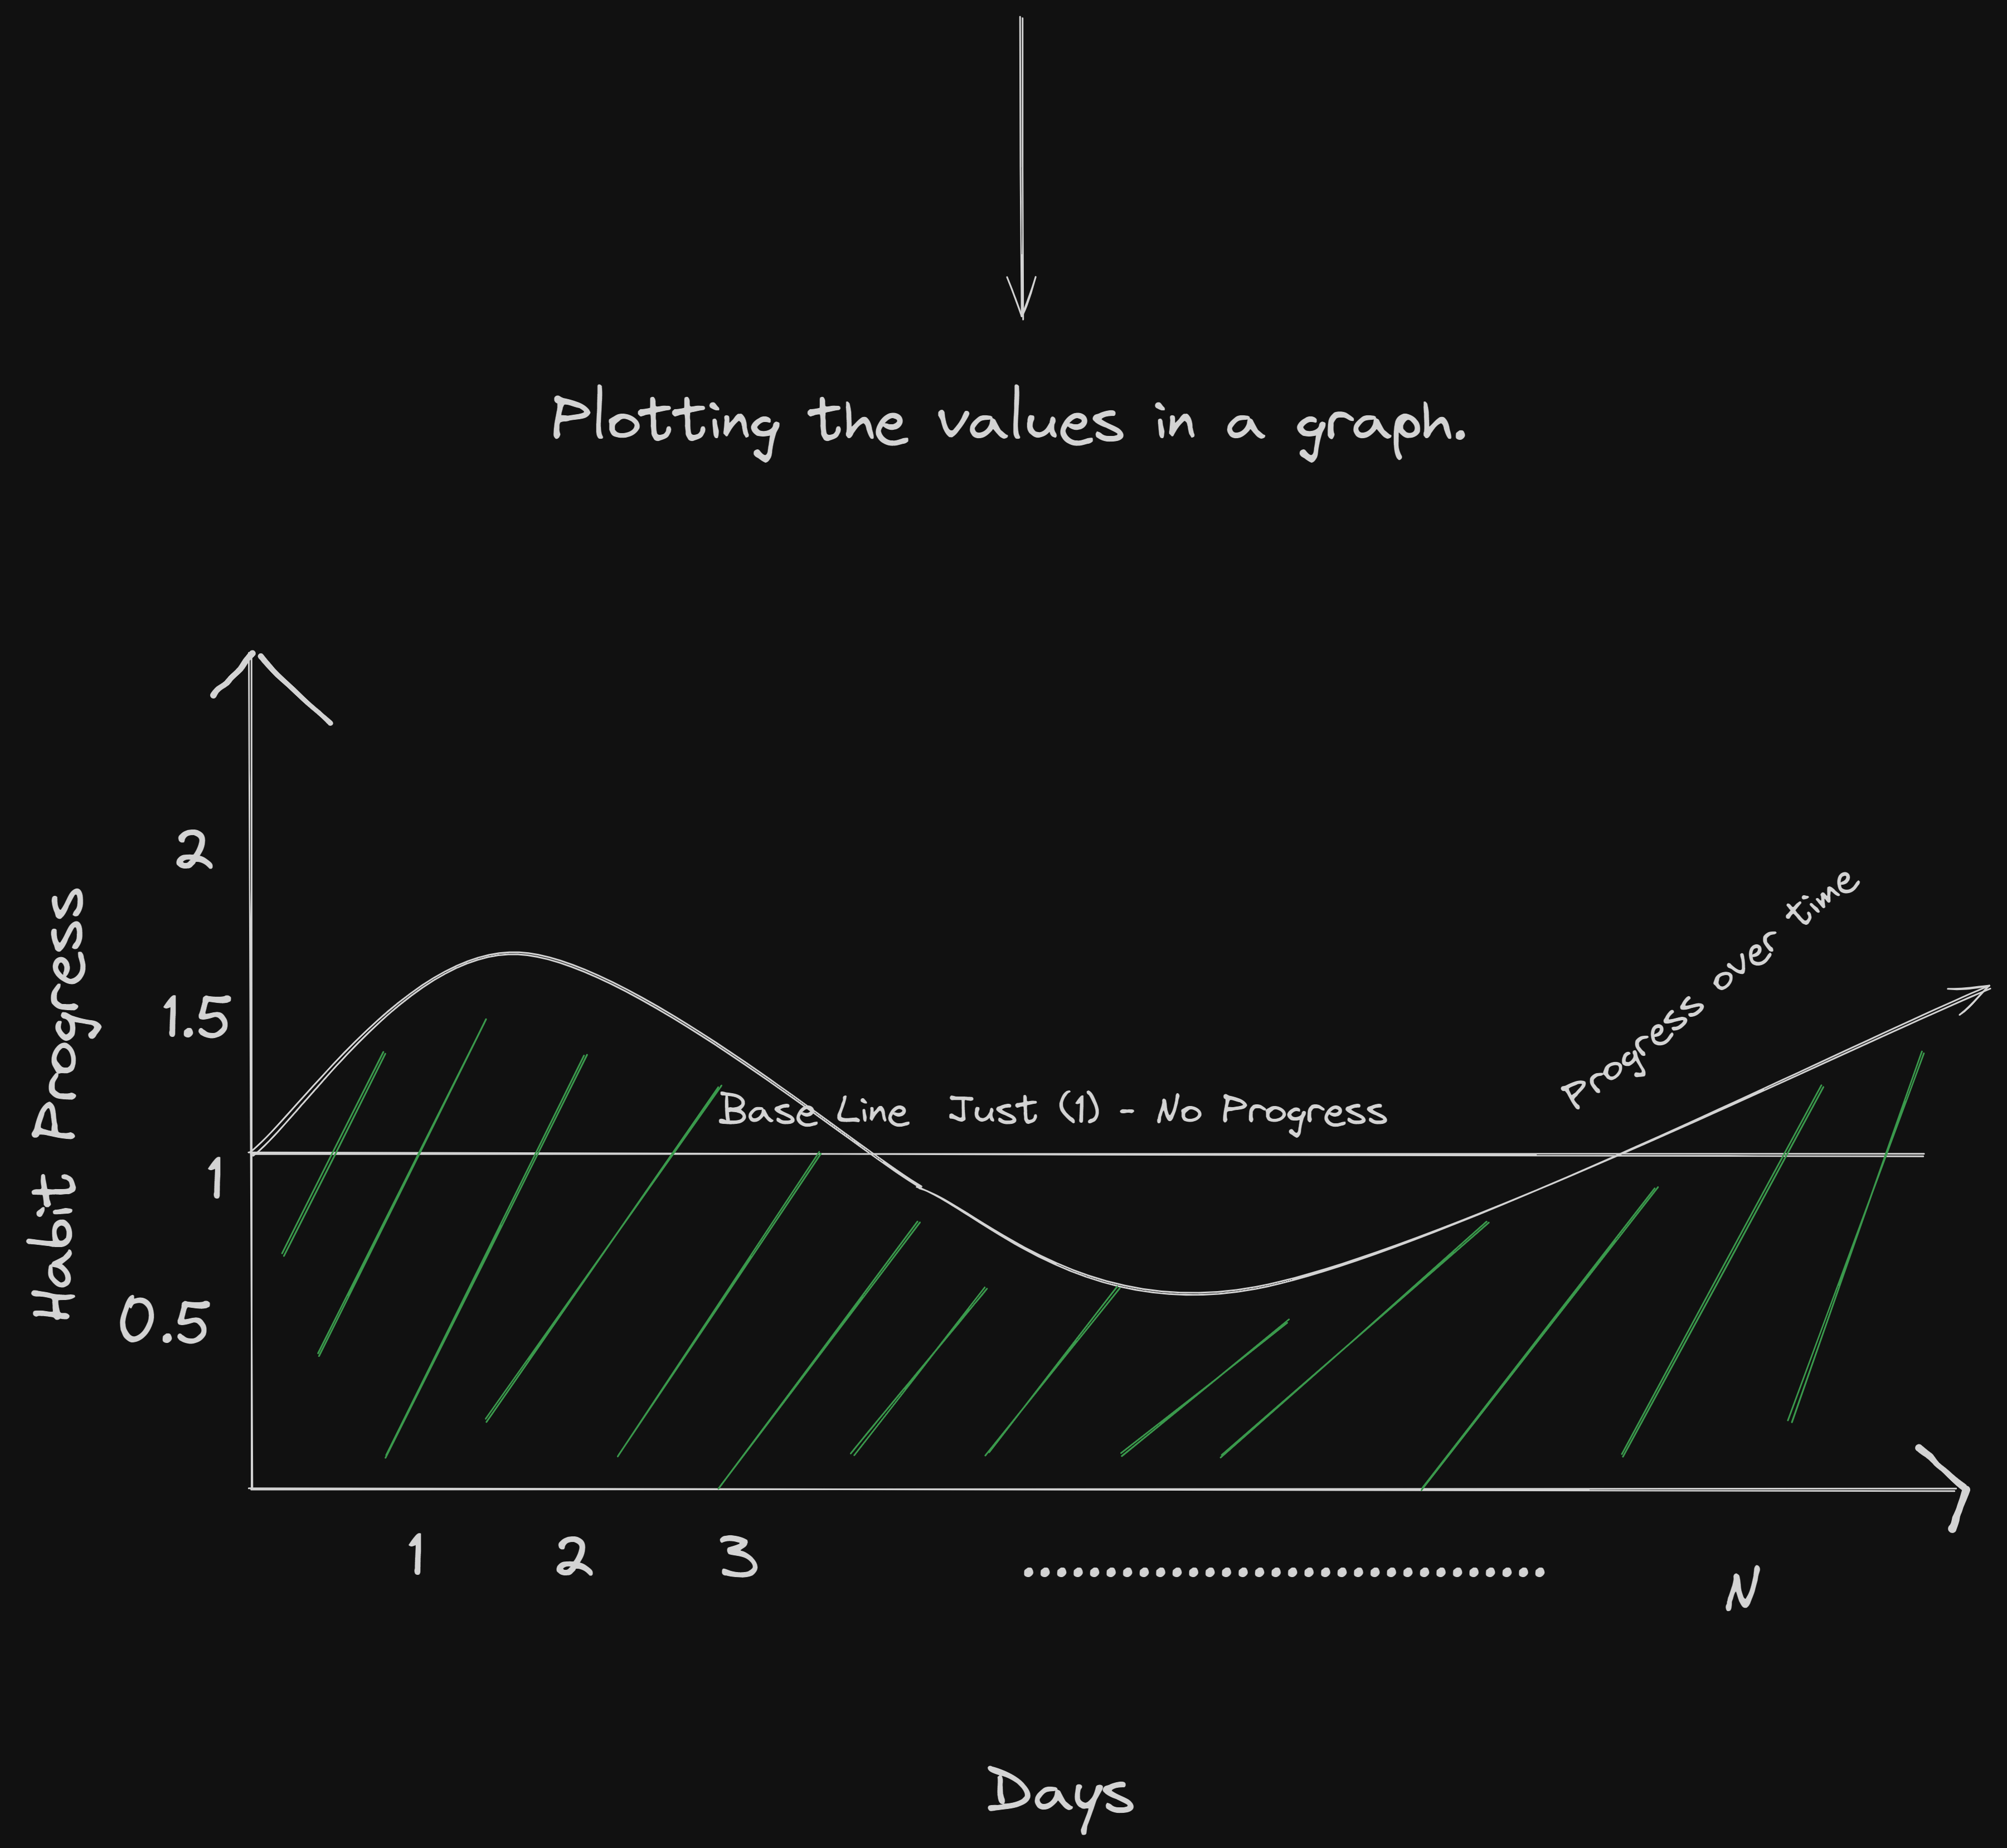
Visualizing Progress: The progress value for each day is plotted on the 1% Progress Graph, allowing you to see how much you're improving over time.
The Significance of Daily Progress
Tracking your progress on a daily level is essential for understanding your overall improvement and staying motivated. Here's why the 1% Progress Graph is such a powerful tool:
-
Visual Motivator: Seeing your progress graphed out on a daily basis provides you with a visual motivator to keep pushing forward. Even small improvements can be significant when viewed over time.
-
Understanding Improvement: The 1% Progress Graph helps you understand how much you're really improving with each day you show up. Whether you're making steady progress or facing setbacks, our tool gives you a clear picture of your growth trajectory.
-
Patience and Consistency: Progress takes time, and the 1% Progress Graph reminds you that it's okay to start small. Just like compound interest, consistent effort over time leads to exponential growth.
Embracing the Journey
It's important to remember that progress isn't always linear, and there may be days when it feels like you're not making any headway. However, every step forward, no matter how small, contributes to your overall growth. Whether you're aiming to show up every day for a year or just starting out on your journey, our tool is here to support you every step of the way.